
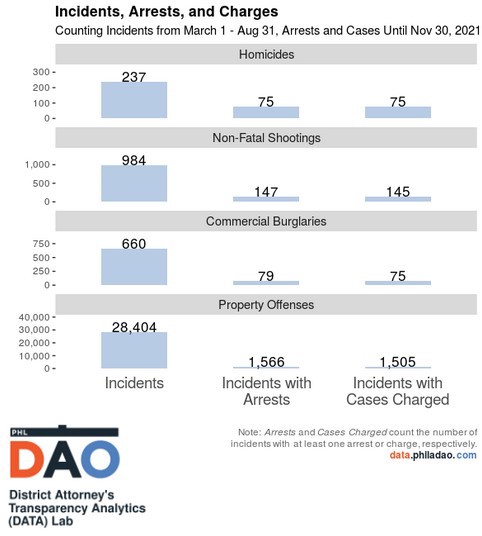
We recently made changes to the Incidents-Arrests-Charges graphics that appear in our monthly Justice Journal newsletter. Previously, the graphics showed the number of incidents from the previous month, as well how many of those incidents led to arrests by police and cases being charged by the District Attorney’s Office (see our previous data story to learn more about the incident-arrest-charging pipeline).
The new graphics will present the same sorts of data, with a lag that allows for more time to pass between an incident and an arrest or charge. Instead of reviewing incidents from the past month, we are now counting incidents during a six-month period, with a three-month buffer to allow for arrests and charges to occur following an incident.
These changes reflect better the reality of investigations and arrests, particularly for homicides and non-fatal shootings. The arrest rate for shootings is very low, but our previous method made it appear to be lower than reality. For example, if a shooting occurred on the last day of a month, the graphic — which was produced the next day — likely would not have counted any arrest or cases charged. The revised format of the charts, counting across a longer time period, allows for a broader view of Philadelphia’s criminal legal system.
We hope that these changes will balance the time-consuming nature of investigations while still providing timely updates to Philadelphians. If you have any questions, please contact [email protected].