By District Attorney’s Transparency Analytics (DATA) Lab
Two new charts highlight 1) the number of crime incidents reported to or observed by law enforcement, arrests made, and cases opened, and 2) case outcomes. We call them “IAC Sankey” and “Case Outcomes Sankey,” respectively, and will be releasing them every month. For more background on the recent development of these new visuals, please read this data story.
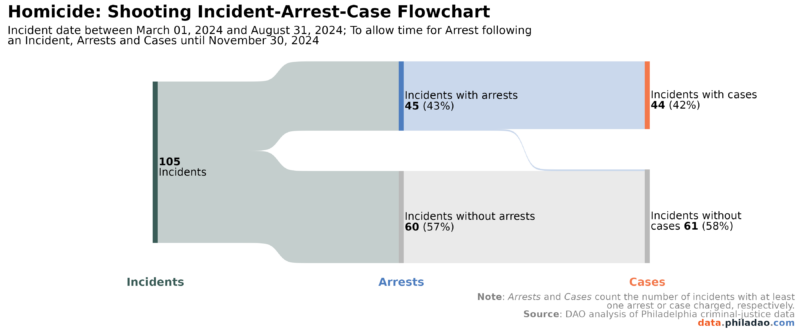
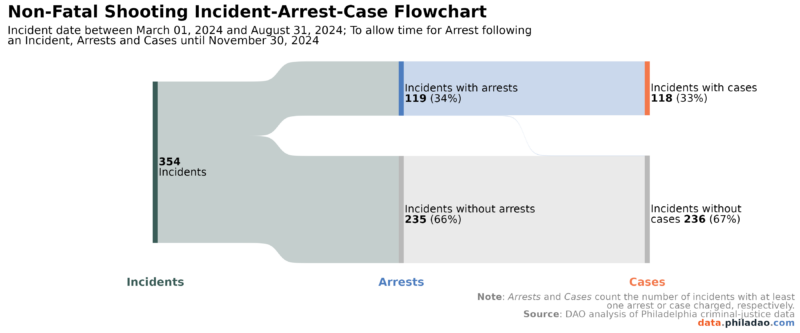
Generated by the District Attorney’s Transparency Analytics (DATA) Lab, the Incident-Arrest-Case Sankey, or IAC Sankey, starts by showing the number of crime incidents between March 1, 2024, to August 31, 2024. Incidents can either be reported by the public (e.g., by calling 9-1-1) or observed by law enforcement. The graphs then show the number of incidents that resulted in arrests made by Philadelphia Police Department (PPD) or other law enforcement (e.g., SEPTA, university police), and then with cases opened by the District Attorney’s Office (DAO) from that six-month period up to and including November 30, 2024. We include the 3-month lag to allow time for incidents that occurred later in the March-August time period to be resolved, e.g., by arrest.
The incident types depicted are homicides and non-fatal shootings. Note that the graphs also depict the total number of incidents that did not result in an arrest. When arrests are made in homicide and non-fatal shootings, our office files charges in almost all cases brought by police for which sufficient evidence exists. For incidents that had a resulting arrest and case opened, we show the case outcomes for those offense categories.
Homicide Incidents – Arrests – Charges:

Non-Fatal Shooting Incidents – Arrests – Charges:

Note: The IAC Sankeys shown here use district control numbers as the unit of analysis, so a shooting with multiple victims will be represented as a single incident. By contrast, our Public Data Dashboard’s Incident Report counts the number of shooting victims. This is an example of the intricacies of this data and how choices about units of analysis impact how events are represented numerically.
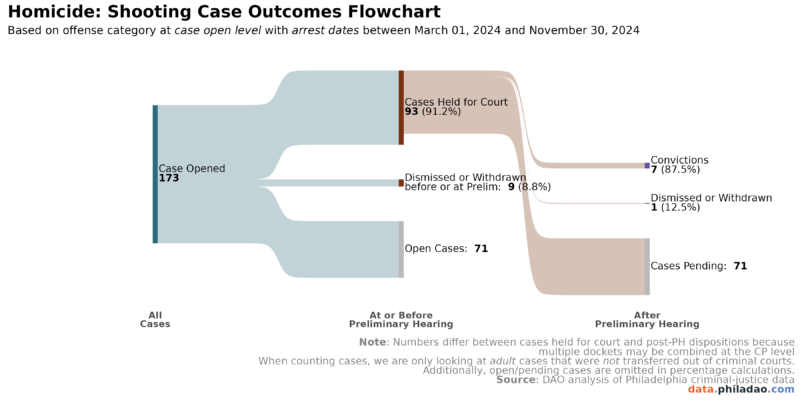
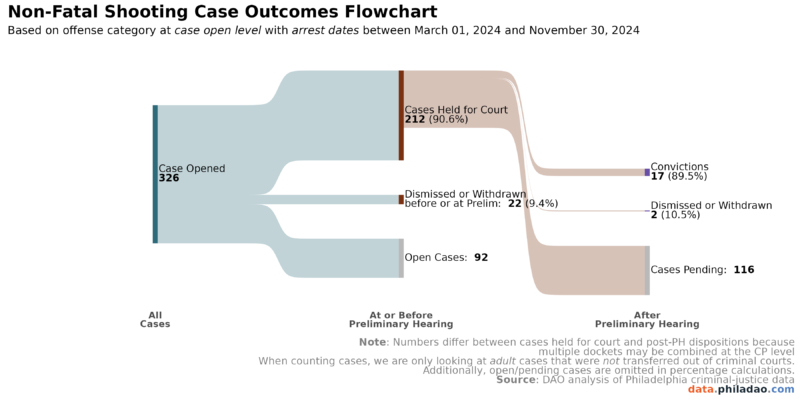
We are also excited to introduce the “Case Outcomes Sankey.” While our dashboard has included Case Outcome reports since 2019, pairing the Case Outcomes Sankey with the IAC Sankey allows viewers to see the flow from incident to arrest to case initiation through case resolution – providing a fuller picture of the systemic response. The Case Outcomes Sankey starts by showing the total number of cases opened for arrests that occurred between March 01, 2024, and November 30, 2024. It then highlights the Preliminary Hearing phase: the first determination of whether the prosecution has met the legal burden to proceed with the case (prima facie; showing that more likely than not, the defendant committed the crime in question). At this juncture, cases can either be held for court, dismissed or withdrawn, or are still awaiting a preliminary hearing (an “open case”). Cases that are held for court proceed through the court system, and the next phase shows the outcome of the case: whether the result was a conviction, withdrawal or dismissal, or a not guilty finding. For homicides and non-fatal shootings, the bulk of cases are pending an outcome due to how long these cases generally take to move through the system and resolve (see our Case Length report for more information).
Homicide Case Outcomes:

Non-Fatal Shooting Case Outcomes:

Please note that the Incident-Arrest-Charges graphics rely on offense categorization at incident, while the Case Outcomes graphics shown here rely on offense categorization at case open, which may or may not match the original incident categorization. See our Dashboard Limitations page for more information about these nuances. We also encourage you to explore the rest of the Public Data Dashboard for reports showing the latest stats and research on Philadelphia’s criminal legal system.
We are eager to hear what you think about these visuals and if they are helpful in understanding a complex system. Please submit feedback, questions, and comments to [email protected].