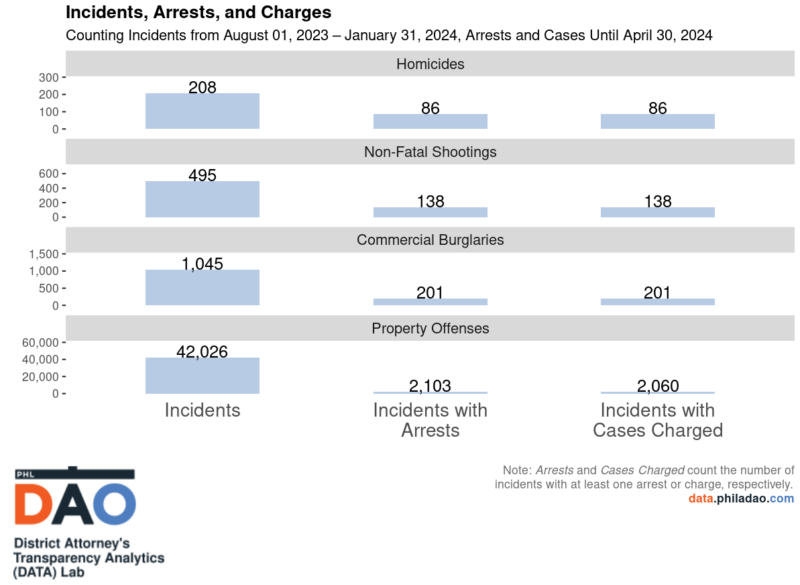
The chart below generated by the District Attorney’s Transparency Analytics (DATA) Lab highlights the number of incidents reported by the public to the Philadelphia Police Department (PPD) from August 1, 2023, to January 31, 2024. The graph then breaks down the number of incidents with arrests made by PPD and incidents with cases charged by the DAO, including commercial burglaries, homicides, non-fatal shootings, and property offenses from that six-month period up to and including April 30, 2024. The first column indicates the number of incidents reported to PPD for each category. The second column indicates the number of incidents where PPD made arrests. The third column indicates the number of cases charged that were submitted to our office by PPD.
Our office files charges in almost all cases brought by police for which sufficient evidence exists. Check out this previous DATA Story to learn more about the Incident-Arrest-Charge Funnel, and bookmark our DATA Dashboard for the latest stats and research on Philly’s criminal justice system.
